ACTUAL FOREX TRADING


The Essential Guide to Technical Analysis

"Technical Analysis is one of my favourite things about Forex trading. It's not just fascinating; it can also be rewarding when done correctly. This guide will teach you everything you need to know about using technical analysis to trade Forex"
THE ESSENTIAL GUIDE TO TA: INTRODUCTION
1.1 The What and Why of Technical Analysis
Technical analysis (TA) is the study of historical prices. This study is typically performed on price charts.
Traders and investors use technical analysis to help predict future prices. A key to successful trading is accurately predicting future price direction and movement. TA is a tool to help with price predictions.
1.2 Price Charts
A price chart displays historical pricing information. The X (horizontal) axis displays dates and times, and the Y (vertical) axis displays prices.

1.3 Timeframes
Price charts will look different depending on the selected timeframe. Even though historical price data doesn't change, the amount of data you display changes the appearance of the price chart.
A timeframe determines how often the chart records price data. A monthly timeframe will show the closing price at the end of each month. A daily timeframe shows the closing price each day. The higher the timeframe, the more historical the pricing information is. Monthly timeframes can show decades of price data, i.e. the last 240 monthly closing prices. Lower timeframes won't go back as far, but give quicker, more recent readings; for example, the 1-hour timeframe could show the last 240 hourly closing prices.
Day traders typically use lower timeframes, such as the daily, 1-hour, 15-minute, and 5-minute charts.
Swing traders typically use higher timeframes, such as the monthly, weekly, daily, 4-hour, and 1-hour charts.
1.4 Is Technical Analysis Reliable?
Yes, and no. TA is a fantastic tool. It is not a crystal ball.
At a minimum, TA helps a trader make sense of the market. It shows where it has been, what is happening now, and what could happen in the future, allowing a trader to plan for outcomes such as price reversals and trends. Many traders use TA to plan their market entries, exits, stop losses, and take profits.
From my experience, TA works best when it's combined with fundamental analysis.
1.5 What is Price Action?
Price action is historical price movement. It includes how price has reacted to events, price reversals, trends, patterns, highs, and lows. Basically, any historical price movement is price action. You can study and analyse it as part of technical analysis.
1.6 What are Technical Indicators?
Indicators are equations that use historical price data to help traders and investors understand price action. Indicators are shown on price charts.
Below is an example of a price chart with 3 indicators (2 oscillator indicators and a moving average).

THE ESSENTIAL GUIDE TO TA: Price Action
2.1 Price Action Explained
Historical price movements are price action. No matter how price has moved, you can study and analyse its price action.
Price action includes price reversals, trends, highs, lows, and patterns.
2.2 Trends
The most profitable way to trade Forex is to catch a trend, i.e. follow a long-term bullish or bearish move.
When the market is bullish and the trend is up, this is called an uptrend. When the market is bearish and the trend is down, this is called a downtrend.
Trends consist of swing highs and swing lows, which form waves or steps on price charts. An uptrend is a series of higher swing highs and swing lows. A downtrend is a series of lower swing highs and lows.


2.3 Ranges
When price is not trending, it is ranging. This means that the price action is choppy or moving sideways. It is not trending.

2.4 Horizontal Support and Resistance
Horizontal support and resistance are price levels where price tends to reverse.
The market has a "memory". Where price has reversed in the past is where it may reverse in the future. In other words, certain price levels can cause the price action to reverse or change direction.
Levels under price are called support levels. These are horizontal areas that hold price up, i.e., where a bearish move can become bullish. In other words, a bullish reversal.
Levels above price are called resistance levels. These are horizontal areas that push price down, i.e., where a bullish move can become bearish. In other words, a bearish reversal.

2.5 Diagonal Support and Resistance
Support and resistance aren't just horizontal. They are also diagonal.
Diagonal support and resistance form when price is trending.

2.6 Reversal Patterns
Price action forms patterns. These patterns signal that a trend may continue, start, or end. Price action patterns that signal the end of a trend are called trend reversal patterns.
The most common trend reversal patterns are double top and bottom patterns, and head and shoulders patterns.


2.7 Breakout Patterns
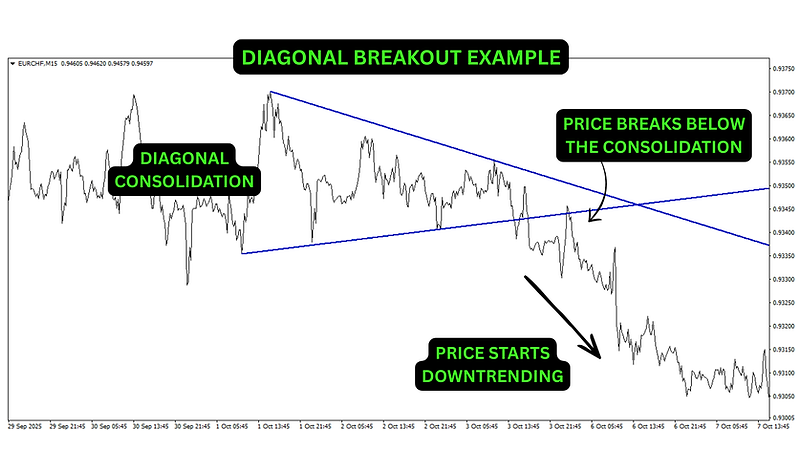
Breakout patterns form after a consolidation period (when price action is typically tight and moves sideways).
Breakout patterns signal that a trend could be starting. A break above the consolidation may signal the start of an uptrend. A break below the consolidation can signal the start of a downtrend.

2.8 Try Analysing Price Action Yourself
Price charts are free with demo accounts. I strongly recommend opening a free account and studying the price charts. Try to identify the price action, such as trends, ranges, reversal patterns, and breakout patterns.
IC Trading. Open a free demo trading account and download their free MT4 trading platform. I have a guide on using the MT4 trading platform.
TradingView. Open a web-based demo account to access charts instantly.
THE ESSENTIAL GUIDE TO TA: INDICATORS
3.1 The What and Why of Technical Indicators
Technical indicators are mathematical calculations based on historical price data. Indicator results are displayed on price charts, typically as an overlay on the chart or as an oscillator at the bottom of the chart.
3.2 Moving Averages
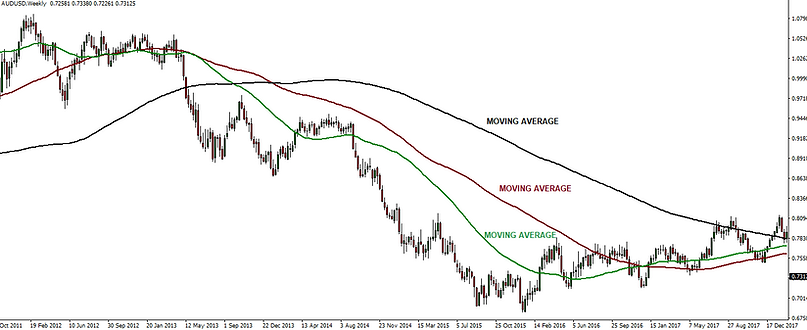
The most common technical indicators are moving averages.
Moving averages help a trader identify potential price direction and can act as support and resistance.
Learn more about moving averages in my Complete Guide to Moving Averages.
3.3 Oscillator Indicators
Oscillator indicators help a trader identify potential price reversals and momentum.

3.4 A Word of Warning
Use only one or two indicators. Too many indicators can lead to information overload. Bear in mind that indicators are built to help you make sense of the price action, not to replace it.
THE ESSENTIAL GUIDE TO TA:
ADDITIONAL ITEMS
4.1 Using Multiple Timeframes
Forex traders must analyse multiple timeframes, not just a single timeframe.
The timeframes you use will depend on the type of trader you are. Shorter-term traders typically use lower timeframes. Longer-term traders typically use higher timeframes. However, no matter the type of trader you are, the following timeframes are all relevant and should be used as part of a trader's technical analysis:
The Daily. This provides essential data, such as key support and resistance levels and setups.
The 4-hourly. Ideal for identifying the longer-term trend and overall momentum.
The 1-hourly. Helps to spot clear entry and intraday direction.
Multiple timeframe analysis (MTA) is the study of multiple timeframes. It involves analysing price action on more than one timeframe to help more accurately identify price direction, support and resistance, and trade entry and exit.
4.2 Combining Analysis
The best traders keep open-minded and don't narrow their analysis to a single method. They study price action, use 1 or 2 technical indicators, analyse multiple timeframes, and combine technical analysis with fundamental analysis.
Below is an example of how a professional trader's price chart setup may look:

4.3 Japanese Candlesticks
Traders typically use Japanese candlestick charts to display price data rather than line charts.
Japanese Candlesticks show the open, close, high, and low for a specified period. On a 1-hour chart, a candlestick shows 1 hour of price action. A daily chart will show a day's worth of price action. And so on.
Learn more about Japanese Candlesticks in my Free Technical Analysis Course.

Learn how to trade Forex: The ULTIMATE Forex Course