ACTUAL FOREX TRADING
Price Action for Beginners (2026): Full Course
Learn to read price charts - the basics of Forex Price Action & Technical Indicators

"Price action is the foundation of technical analysis. Knowing how price moves and behaves is paramount to becoming a successful Forex trader.
Learn price action and technical analysis for FREE. See my free online course below..."
Forex Price Action Course: An Introduction to Price Action
What is price action in Forex?
The prices of currencies are forever changing. Currency pairs move up and move down. These movements are displayed on charts called price charts. The historical price movements and patterns formed on price charts are called price action. Price charts show how price has acted in the past, hence the term price action.
Price charts show a Forex trader a historical record of price movements and behaviour. They also show price patterns, price highs, and price lows.
Price action is the foundation of technical analysis. It includes:
1. Identifying the current price direction
2. Identifying high and low points of price
3. Identifying patterns formed by price
Forex Price Chart Example:
Why use price action?

Price Action Continued
Price action can help a trader predict where future prices will be. This increases the chances of a trader making money from Forex trading.
I am a professional Forex trader. I use price action daily. It plays a significant part in my Forex trading decisions.
Price action is universal. Once learned, you can use price action to trade other financial markets, not just Forex.
Trading using price action
This step-by-step price action trading course will teach you the basics. Watch the video below for a more detailed introduction. Then, carry on with the program below. The course is all online, 100% free, and includes a free price action PDF!
You have joined this series on step 2. If you you like to start from the beginning, then go to Step 1 of Forex Trading Basics.

Key Price Action Terminology
Price Action - the historical movement of price
Price Chart - a chart displaying historical price data
Price Action Trader - a trader who analyses price action to forecast future price direction
Price Action Tutorial: Part One
Key Content:
-
Course overview
-
What is price action
-
Why use price action
-
What are price charts
-
Price chart example
Price Action Basics: Trending Markets Explained
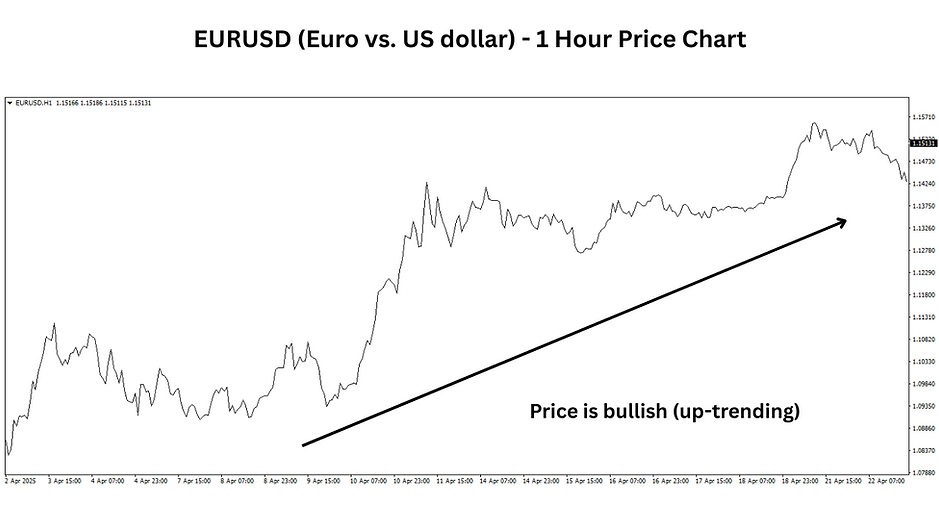
When the price of a Forex pair moves in a generally upward direction, this is called an uptrend. Sometimes, this is referred to as a bullish market.
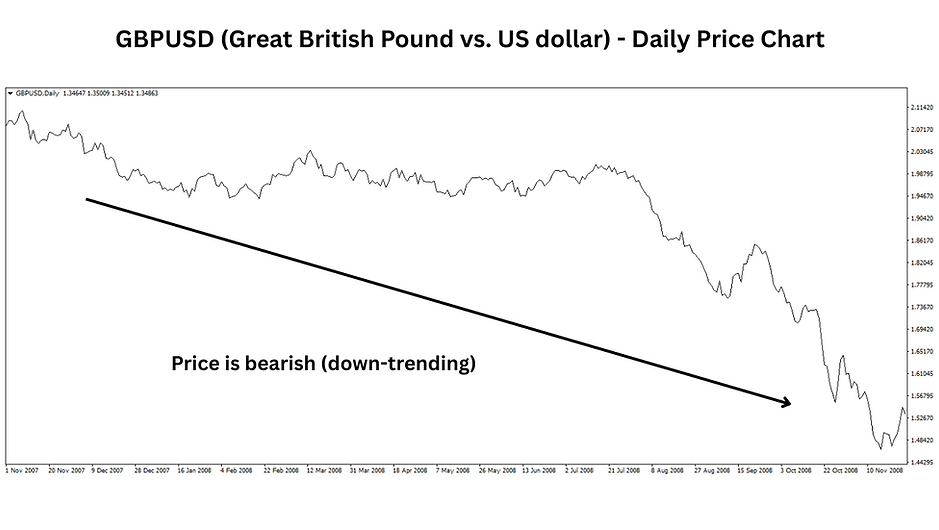
When the price of a Forex pair moves in a generally downward direction, this is called a downtrend. Sometimes, this is referred to as a bearish market.
Forex Pair Trending Examples
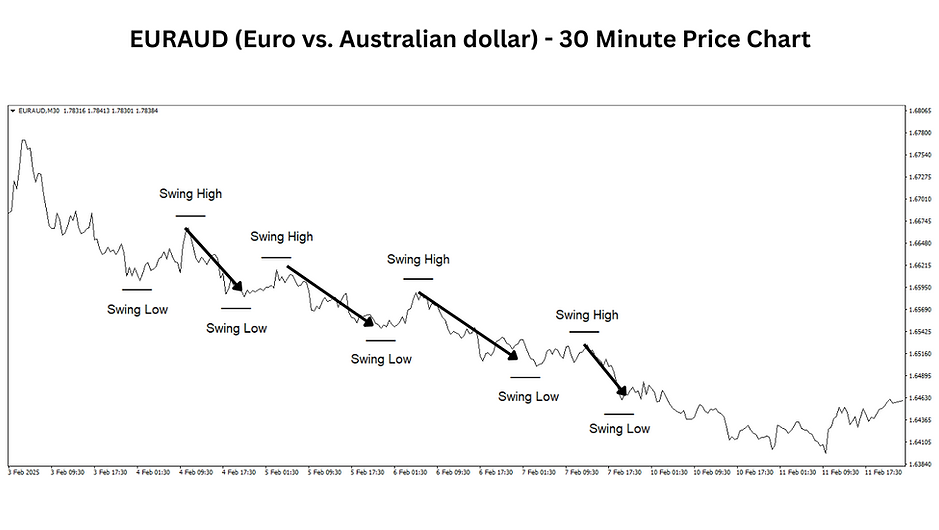
Swing Highs and Lows
Trends have specific characteristics. For example, price forms swings when a currency pair is trending. These swings look like waves or steps on a price chart. They are a series of peaks and troughs.
Uptrends form a series of higher price swings. These are called higher highs and higher lows. In other words, price action forms higher peaks and troughs.
Downtrends form a series of lower price swings. These are called lower highs and lower lows. In other words, price action forms lower peaks and troughs.
Learning how markets trend is critical to successful price action trading.

Key Price Action Terminology
Bullish - when a Forex pair's price is trending upward
Bearish- when a Forex pair's price is trending downward
Price Swings - the swings/steps/waves price action forms when it trends
.png)
Price Action Tutorial: Part Two
Key Content:
-
Uptrends
-
Downtrends
-
Swing highs
-
Swing lows
-
And more
Practice what you're learning!
Get a free demo trading account (including free price charts) and practice. This will definitely help your learning curve!
Need help downloading and logging in?
Read my getting started with a demo account guide
Once logged in, go to my MetaTrader Guide

Price Action Basics: Ranging Markets Explained
If a currency pair is not trending, it could be ranging.
A ranging market means that the price is moving sideways. It is not bullish or bearish. Generally, a range means that the price is moving between two areas of the market. A ranging market can also be called a sideways market, market indecision, or market consolidation.
When a currency pair ranges, the price moves between two horizonal areas of the market. The top of the range is called the range resistance (or horizontal channel resistance). The bottom of the range is called the range support (or horizontal channel support).
When the price reaches either the range support or resistance, it can reverse.

Key Price Action Terminology
Ranging - when a currency pair is moving in a sideways direction
Range Resistance - the top area of the range
Range Support - the bottom area of the range

Price Action Tutorial: Part Three
Key Content:
-
Ranges explained
-
Horizonal channels
-
And more
Would you rather have a one-to-one tutor?
Sign up for my Forex Mentorship - CLICK HERE

Forex Price Action Course: Japanese Candlesticks Explained
The majority of Forex traders use Japanese candlesticks. They play an essential part of Forex price action trading.
They may look daunting initially, but they are relatively easy to understand.
A Forex trader analyses - "reads" - candlesticks. Being able to read Japanese candlesticks can help a Forex trader. They can indicate where future prices might be. If a trader knows where future prices may be, he can use this to his advantage and make money!
Each candlestick has a candle body and candle wicks.
The candle body is created by the opening and closing of price of the candle.
The wicks are created by the high and low of the candle.

Key Price Action Terminology
Candlestick - a price action tool that displays the open, close, high, and low of price
Candle Body - the price open and close
Candle Wick - the low or high of price

Price Action Tutorial: Part Four
Key Content:
-
Japanese Candlesticks
-
Candle Bodies
-
Candle Wicks

"Ready for a break? Learn more about me and how I became a Forex trader in my free video, 'I'm a 38-year-old Forex Trader and this is MY STORY"
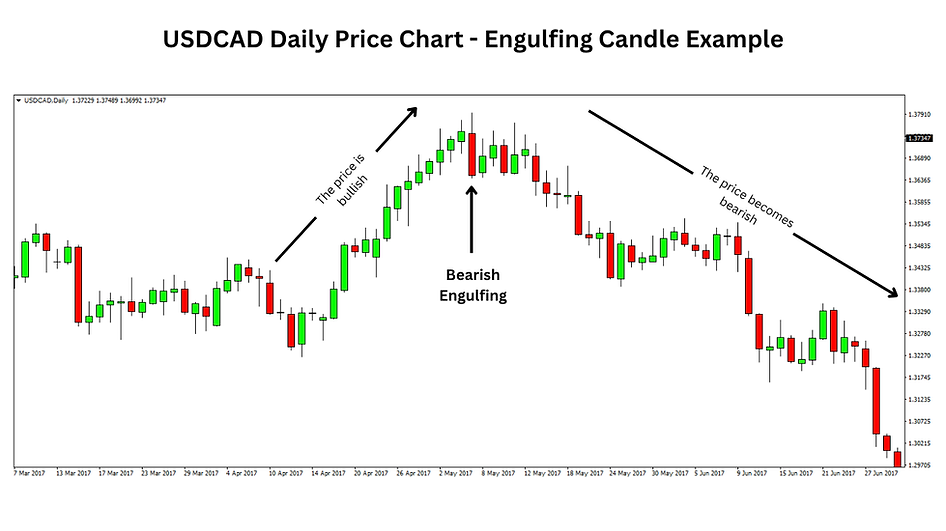
Forex Price Action Course: Engulfing Candles Explained
Certain Japanese Candlesticks can signal future price direction. These candlesticks are called candlestick setups. Sometimes, candlestick setups are referred to as triggers or price action setups.
Engulfing candles are a price action setup. They are one of the most simple and common setups used by traders.
To identify an engulfing candle setup, you'll need to use the opening and close prices of two candlesticks.
-
Find two candlesticks where the second candlestick closes in the opposite direction of the first. For example, a bullish candle followed by a bearish candle or a bearish followed by a bullish.
-
The second candle must have a wider opening and closing price than the first.
A bullish candle followed a bearish engulfing candle signals potential bearish direction. A bearish candle followed by a bullish engulfing candle signals potential bullish direction.


Price Action Tutorial: Part Five
Key Content:
-
Engulfing Candles Explained
-
Engulfing Examples
-
And more...
Forex Price Action Course: Pin Bars Explained
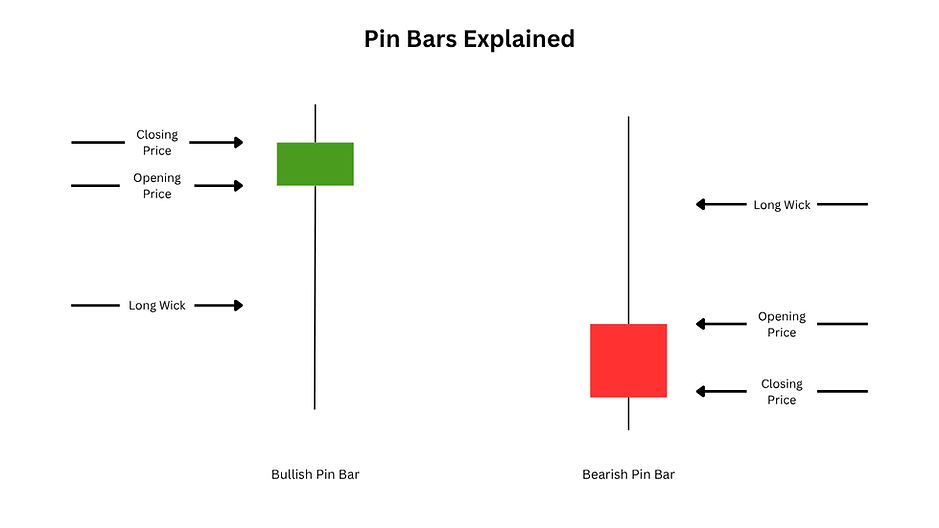
Another standard price action setup is the Pin Bar.
These setups are also called kangaroo tails, hammers, hanging man, and shooting stars.
Pin bars are another simple yet effective price action setup.
A pin bar has a small body and a long wick on one side. They are a single candle setup, meaning analysing multiple candles is not required.
If the long wick is below the body (lower wick), this is a bullish pin bar. This setup signals potential bullish direction.
If the long wick is above the body (upper wick), this is a bearish pin bar. This setup signals potential bearish direction.


Price Action Tutorial: Part Six
Key Content:
-
Pin Bars Explained
-
Pin Bar Examples
-
And more...
Forex Price Action Course: Support and Resistance Explained
As price moves, it forms clear levels and areas of the market of support and resistance.
Support is a level or area below the current price that keeps the price up. These areas have historically been a lot of buying or market bulls. Support levels indicate where buyers potentially are. In support areas, the price could become bullish.
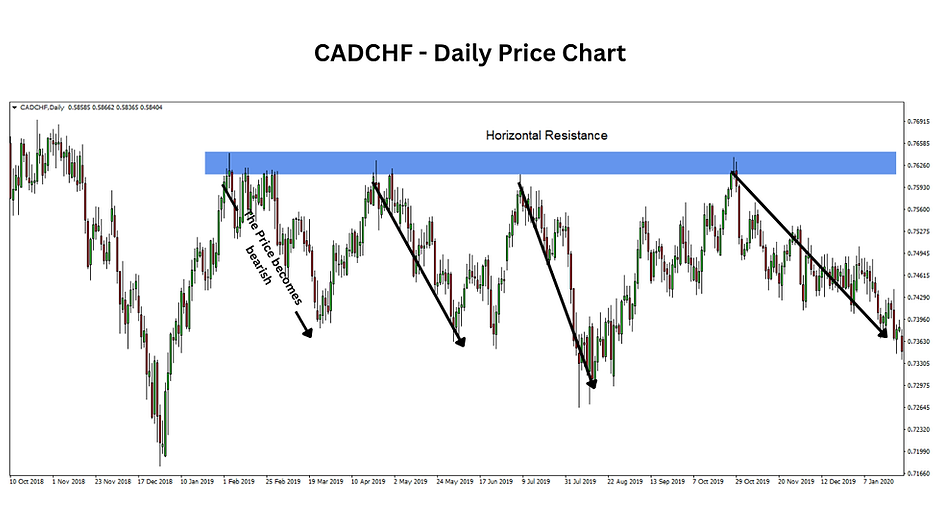
Resistance is a level or area above the current price that keeps the price down. These areas have historically been a lot of selling or market bears. Resistance levels indicate where sellers potentially are. In resistance areas, the price could become bearish.
Below are examples of horizontal support and resistance. These are horizontal areas where price reverses.

There are different types of support and resistance. These are horizontal support and resistance and diagonal support and resistance.


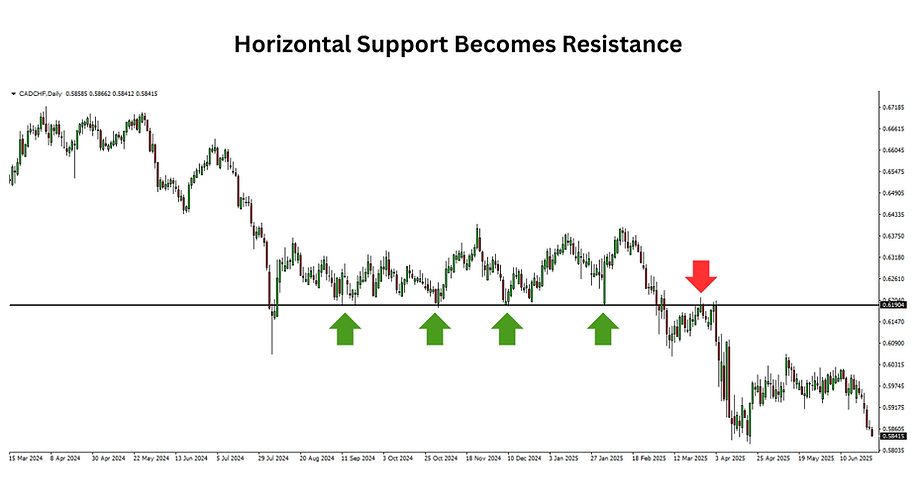
When support is broken, it becomes resistance. When resistance is broken, it becomes support.
The easiest way to remember this is floors (support) become ceilings (resistance), and ceilings become floors.


Price Action Tutorial: Parts Seven-Nine
Key Content:
-
Support and resistance
-
Examples
Forex Price Action Course: Price Patterns Explained
As price moves and trends, it can create patterns.
Price action forms patterns in the Forex market. These patterns can indicate the future price direction, like Japanese Candlestick setups, support, and resistance.
The most common price action patterns are:
-
Double-top patterns
-
Double bottom patterns
-
Head & shoulders patterns
-
Inverted head & shoulders
A head and shoulders pattern consists of three tops (swings). The second (middle) top being larger than the first and third tops. The first and third tops are usually of similar size, creating a pattern that looks like head and shoulders. These patterns signal a change in market direction, i.e. a bullish market becoming bearish.
An inverted head and shoulders is the same pattern but upside-down. It signals that a bearish market could become bullish.


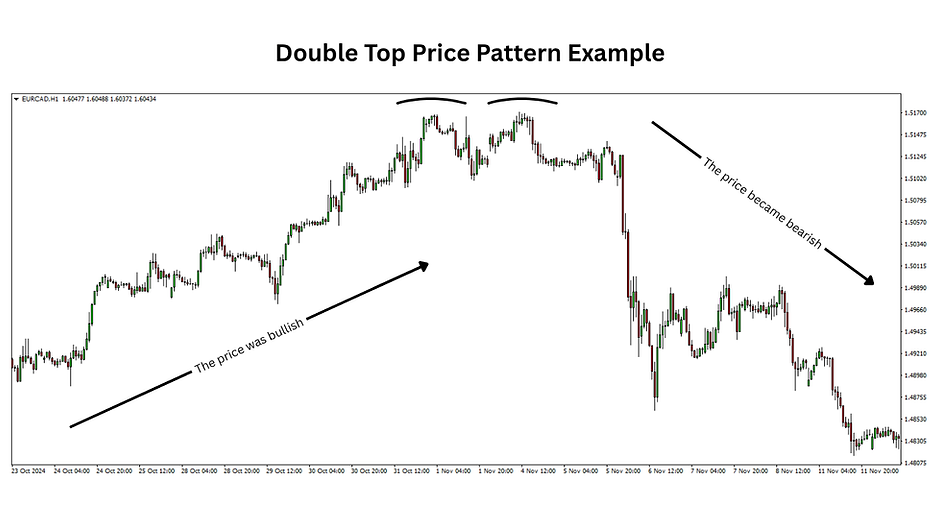
Double top and double bottom patterns also signal a potential change in market direction.
Double tops are two swing highs around the same price area. In a way, they are head and shoulders patterns without the head. They signal a bullish market may become bearish.
Double bottoms are two swing lows around the same price area. They signal a bearish market may become bullish.


Price Action Tutorial: Part Ten
Key Content:
-
Price Action Patterns Explained
-
Head and Shoulders
-
Double Tops and Bottoms